Another Nail In The US Empire Coffin: Collapse Of Shale Gas Production Has Begun

The U.S. Empire is in serious trouble as the collapse of its domestic shale gas production has begun. This is just another nail in a series of nails that have been driven into the U.S. Empire coffin.
Unfortunately, most investors don’t pay attention to what is taking place in the U.S. Energy Industry. Without energy, the U.S. economy would grind to a halt. All the trillions of Dollars in financial assets mean nothing without oil, natural gas or coal. Energy drives the economy and finance steers it. As I stated several times before, the financial industry is driving us over the cliff.
The Great U.S. Shale Gas Boom Is Likely Over For Good
Very few Americans noticed that the top four shale gas fields combined production peaked back in July 2015. Total shale gas production from the Barnett, Eagle Ford, Haynesville and Marcellus peaked at 27.9 billion cubic feet per day (Bcf/d) in July and fell to 26.7 Bcf/d by December 2015:
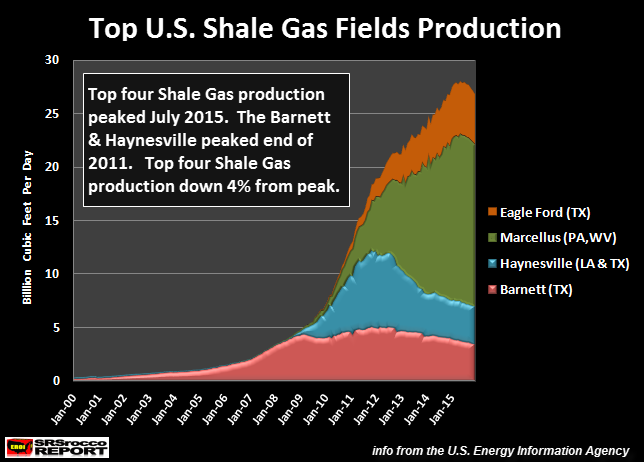
As we can see from the chart, the Barnett and Haynesville peaked four years ago at the end of 2011. Here are the production profiles for each shale gas field:
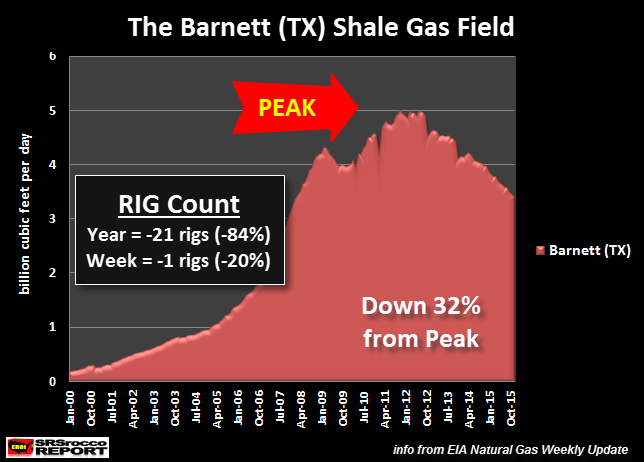
According to the U.S. Energy Information Agency (EIA), the Barnett shale gas production peaked on November 2011 and is down 32% from its high. The Barnett produced a record 5 Bcf/d of shale gas in 2011 and is currently producing only 3.4 Bcf/d. Furthermore, the drilling rig count in the Barnett is down a stunning 84% in over the past year.
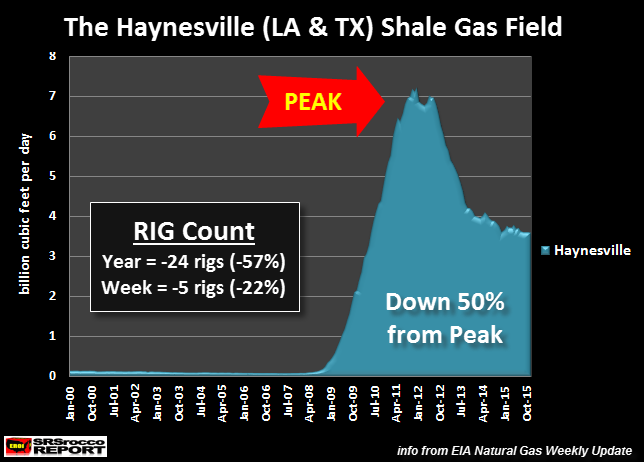
The Haynesville was the second to peak on Jan 2012 at 7.2 Bcf/d per day and is currently producing 3.6 Bcf/d. This was a huge 50% decline from its peak. Not only is the drilling rig count in the Haynesville down 57% in a year, it fell another five rigs this past week. There are only 18 drilling rigs currently working in the Haynesville.
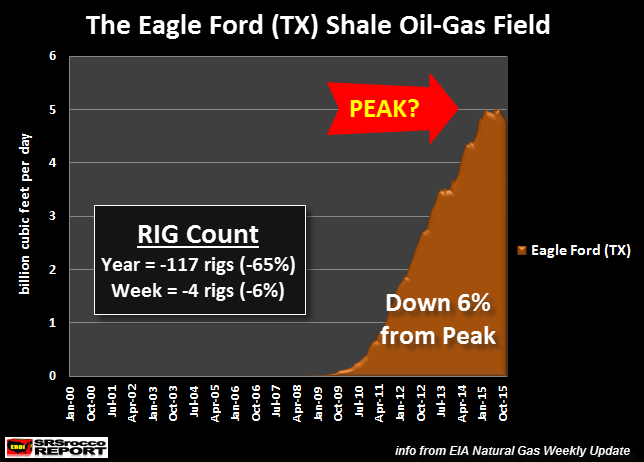
The EIA reports that shale gas production from the Eagle ford peaked in July 2015 at 5 Bcf/d and is now down 6% at 4.7 Bcf/d. As we can see, total drilling rigs at the Eagle Ford declined the most at 117 since last year. The reason the falling drilling rig count is so high is due to the fact that the Eagle Ford is the largest shale oil-producing field in the United States.
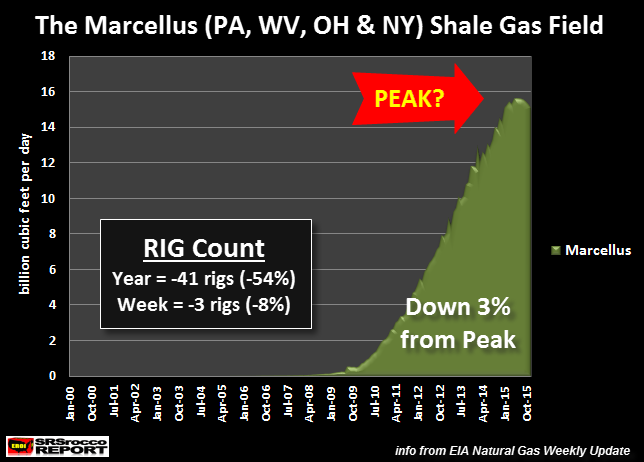
Lastly, the Mighty Marcellus also peaked in July 2015 at a staggering 15.5 Bcf/d and is now down 3% producing 15.0 Bcf/d currently. The Marcellus is producing more gas (15 Bcf/d) than the other top three shale gas fields combined (12.1 Bcf/d).
I have posted the Haynesville shale gas production chart below to discuss why U.S. Shale Gas production will likely collapse going forward:
What is interesting about the Haynesville shale gas field, located in Louisiana and Texas, is the steep decline of production from its peak. On the other hand, the Barnett (chart above in red) had a much different profile as its production peak was more rounded and slow. Not so with the Haynesville. The decline of shale gas production at the Haynesville was more rapid and sudden. I believe the Eagle Ford and Marcellus shale gas production declines will resemble what took place in the Haynesville.
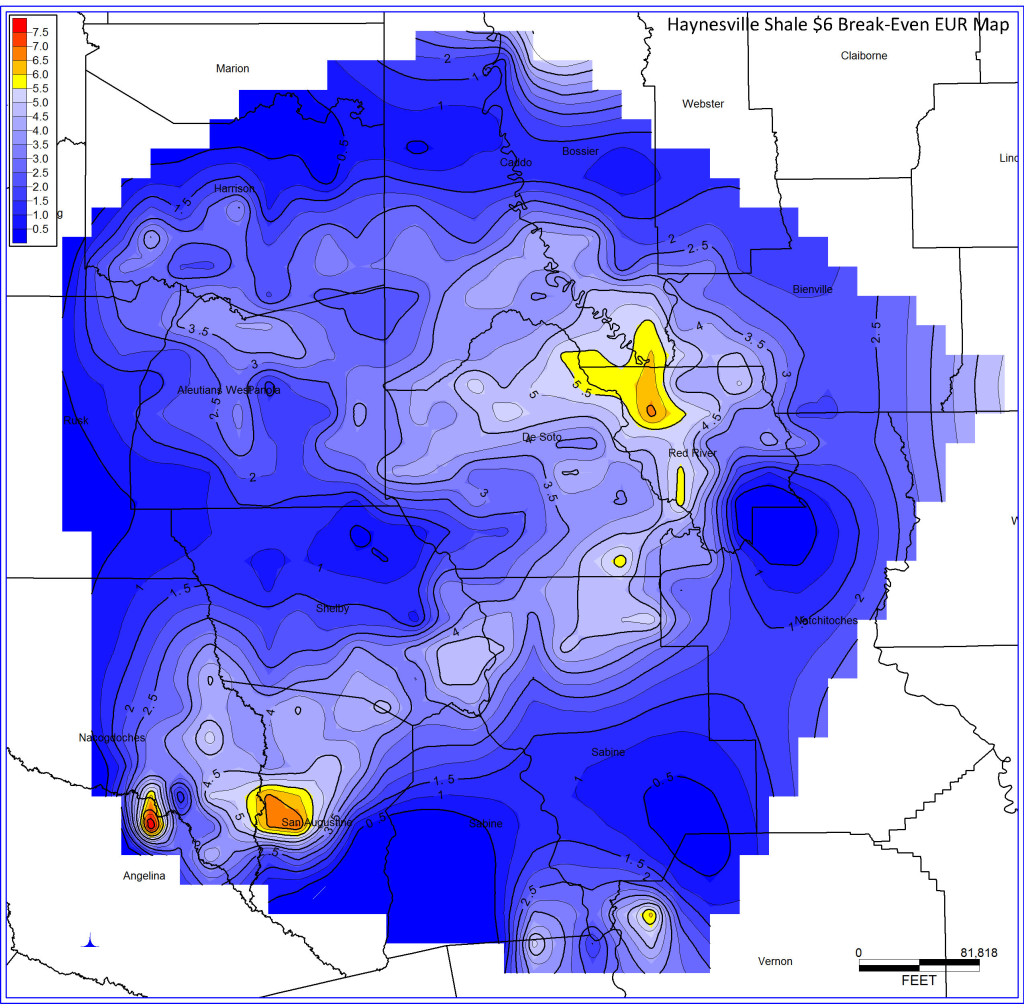
All you have to do is look at how the Eagle Ford and Marcellus ramped up production. Their production profiles are more similar to the Haynesville than the Barnett. Thus, the declines will likely behave in the same fashion. Furthermore drilling and extracting shale gas from the Haynesville was a “Commercial Failure” as stated by energy analyst Art Berman in his Forbes article on Nov 22 2015:
The Haynesville Shale play needs $6.50 gas prices to break even. With natural gas prices just above $2/Mcf (thousand cubic feet), we question the shale gas business model that has 31 rigs drilling wells in that play that cost $8-10 million apiece to sell gas at a loss into a over-supplied market.At $6 gas prices, only 17% of Haynesville wells break even (Table 3) and approximately 115,000 acres are commercial (Figure 2) out the approximately 3.8 million acres that comprise the drilled area of the play.The Haynesville Shale play is a commercial failure. Encana exited the play in late August. Chesapeake and Exco, the two leading producers in the play, both announced significant write-downs in the 3rd quarter of 2015.
Basically, the overwhelming majority of the shale gas extracted at the Haynesville was done so at a complete loss. So, why do they continue drilling and producing gas in the Haynesville?
The reason Art Berman states is this:
What we see in the Haynesville Shale play are companies that blindly seek production volumes rather than value, and that care nothing for the interests of their shareholders. The business model is broken. It is time for investors to finally start asking serious questions.
Chesapeake is one of the larger shale gas producers in the Haynesville as well as in the United States. According to its recent financial reports, Chesapeake received $1.05 billion in operating cash in the first three-quarters of 2015, but spent $3.2 on capital expenditures to continue drilling. Thus, its free cash flow was a negative $2.1 billion in the first nine months of 2015. And this doesn’t include what it paid out in dividends.
The same phenomenon is taking place in other companies drilling for shale gas in the other fields in the U.S. This insanity has Berman perplexed as he states this in another article from his site:
This has puzzled me because the shale gas plays are not commercial at less than about $6/mmBtu except in small parts of the Marcellus core areas where $4 prices break even. Natural gas prices have averaged less than $3/mmBtu for the first quarter of 2015 and are currently at their lowest levels in more than 2 years.
The reason these companies continue to produce shale gas at a loss is to keep generating revenue and cash flow to service their debt. If they cut back significantly on drilling activity, their production would plummet. This would cause cash flow to drop like a rock, including their stock price, and they would go bankrupt as they couldn’t continue servicing their debt.
Basically, the U.S. Shale Gas Industry is nothing more than a Ponzi Scheme.
The Collapse Of U.S. Shale Gas Production Even At Higher Prices
I believe the collapse of U.S. shale gas production will occur even at higher prices Why? Because the price of natural gas increased from $2.75 mmBtu in 2012 to $4.37 mmBtu in 2014, but the drilling rig count continued to fall:
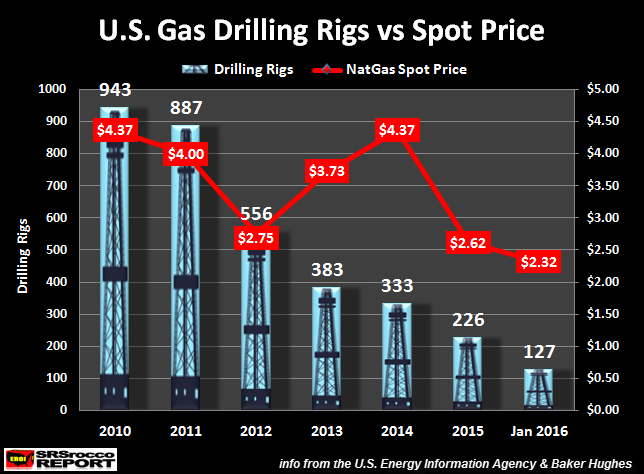
As the price of natural gas increased from 2012 to 2014, gas drilling rigs fell 40% from 556 to 333. Furthermore, drilling rigs continued to decline and now are at a record low of 127. Just as Art Berman stated, the average break-even for most shale gas plays are $6 mmBtu, while only a small percentage of the Marcellus is profitable at $4 mmBtu.
Looking at the chart again, we can see that the price of natural gas never got close to $6 mmtu.. the highest was $4.37 mmBtu. Thus, the U.S. Shale Gas Industry has been a commercial failure.
Now that the major shale gas producers are saddled with debt and many of the sweet spots in these shale gas fields have already been drilled, I believe U.S. shale gas production will collapse going forward. If we look at the Haynesville Shale Gas Field production profile, a 50% decline in 4 years represents a collapse in my book.
The Two Nails In The U.S. Empire Coffin
As I stated in several articles and interviews, ENERGY DRIVES THE ECONOMY, not finance. So, energy is the key to economic activity. Which means, energy output and the control of energy are the keys to economic prosperity.
While the collapse of U.S. shale gas production is one nail in the U.S. Empire Coffin, the other is Shale Oil. U.S. shale oil production peaked before shale gas production:
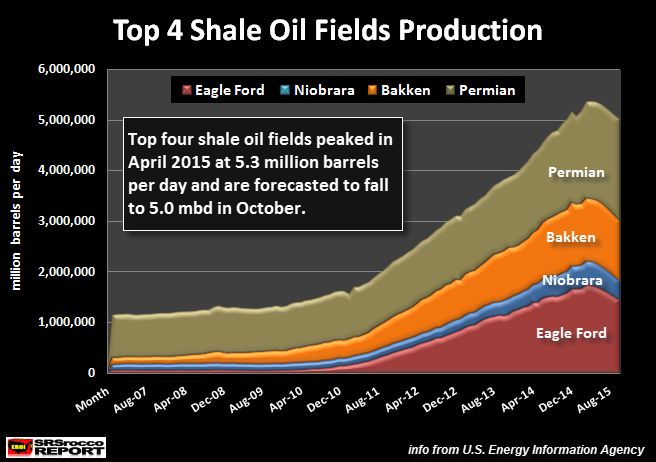
This chart is a few months out of date, but according to the EIA’s Productivity Reports, domestic oil production from the top four shale oil fields peaked in April of 2015… three months before the major shale gas fields (July 2015).
Unfortunately for the United States, it was never going to become energy independent. The notion of U.S. energy independence was built on hype, hope and cow excrement. Instead, we are now going to witness the collapse of U.S. shale oil and gas production.
The collapse of U.S. shale oil and gas production are two nails in the U.S. Empire coffin. Why? Because U.S. will have to rely on growing oil and gas imports in the future as the strength and faith of the Dollar weakens. I see a time when oil exporting countries will no longer take Dollars or U.S. Treasuries for oil. Which means… we are going to have to actually trade something of real value other than paper promises.
I believe U.S. oil production will decline 30-40% from its peak (9.6 million barrels per day July 2015) by 2020 and 60-75% by 2025. The U.S. Empire is a suburban sprawl economy that needs a lot of oil to keep trains, trucks and cars moving. A collapse in oil production will also mean a collapse of economic activity.
Thus, a collapse of economic activity means skyrocketing debt defaults, massive bankruptcies and plunging tax revenue. This will be a disaster for the U.S. Empire.
Keine Kommentare:
Kommentar veröffentlichen